Configure UCT-C Solution using GigaVUE-FM
This section describes how to configure UCT-C through GigaVUE-FM.
Refer to the following section for details.
- Universal Cloud Tap - Container Inventory
- Create Monitoring Domain
- Create Source Selectors
- Create Tunnel Specifications
- Configure Traffic Policy
- View Policy Configurations
- View Traffic Policy Statistics
Universal Cloud Tap - Container Inventory
On the left pane of GigaVUE-FM, go to Inventory > CONTAINER > Universal Cloud Tap - Container.
You can view the following tabs on the Universal Cloud Tap - Container launch page:
|
Tabs |
Description |
|
Monitoring Domains |
Displays the Monitoring Domain details and the connectivity status from GigaVUE-FM to Cluster. The count of reachable and unreachable clusters per Monitoring Domain. |
|
Clusters |
Displays Kubernetes Clusters, along with UCT-C Controller information and the total number of nodes per Cluster. Also displays GigaVUE-FM to Controller connectivity and Heartbeats status. Heartbeat status is from UCT-C Controller to GigaVUE-FM. Notes:
|
|
Nodes |
Displays the Nodes from all Kubernetes Clusters along with UCT-C TAP information and Total Pods per Node. UCT-C TAP status should be connected for deployments for respective Worker Nodes to go through. If the UCT-C TAP status for a Worker Node is not shown as Connected, the deployment for that Worker Node will not go through. Note: A maximum of 500 nodes are supported per cluster, with qualified support available for up to 250 nodes. For any issues, Contact Technical Support. |
|
Pods |
Displays the list of Pods from all Kubernetes Clusters. For each Pod, all metadata - Pod Name, Labels, IPs, Namespace, Service Name, Service IPs, Node Name, Containers, and Host Network information is displayed. Note: A maximum of 25K pods are qualified across single or multiple clusters. Pod counts beyond this limit are expected to function. For any issues, Contact Technical Support. |
|
Settings |
Displays the general settings which include disconnected UCT-C Controller or TAP Purge Interval days, and the maximum number of Clusters allowed in GigaVUE-FM. |
To view and filter the list of Monitoring Domains, Cluster, and Node details, perform one of the following:
-
Select the
 filter button on the left side of any of the above-listed tabs.
 -
Create a new Monitoring Domain, edit, and delete the existing Monitoring Domains.
On Clusters, Nodes, and Pods screens, you can click the Filter button on the right side to filter the details on that particular screen.
Create Monitoring Domain
To create a monitoring domain in GigaVUE-FM:
| 1. | Go to Inventory > CONTAINER > Universal Cloud Tap - Container > Monitoring Domains. |
| 2. | In the Monitoring Domains page, select New. The New Monitoring Domain wizard appears. |
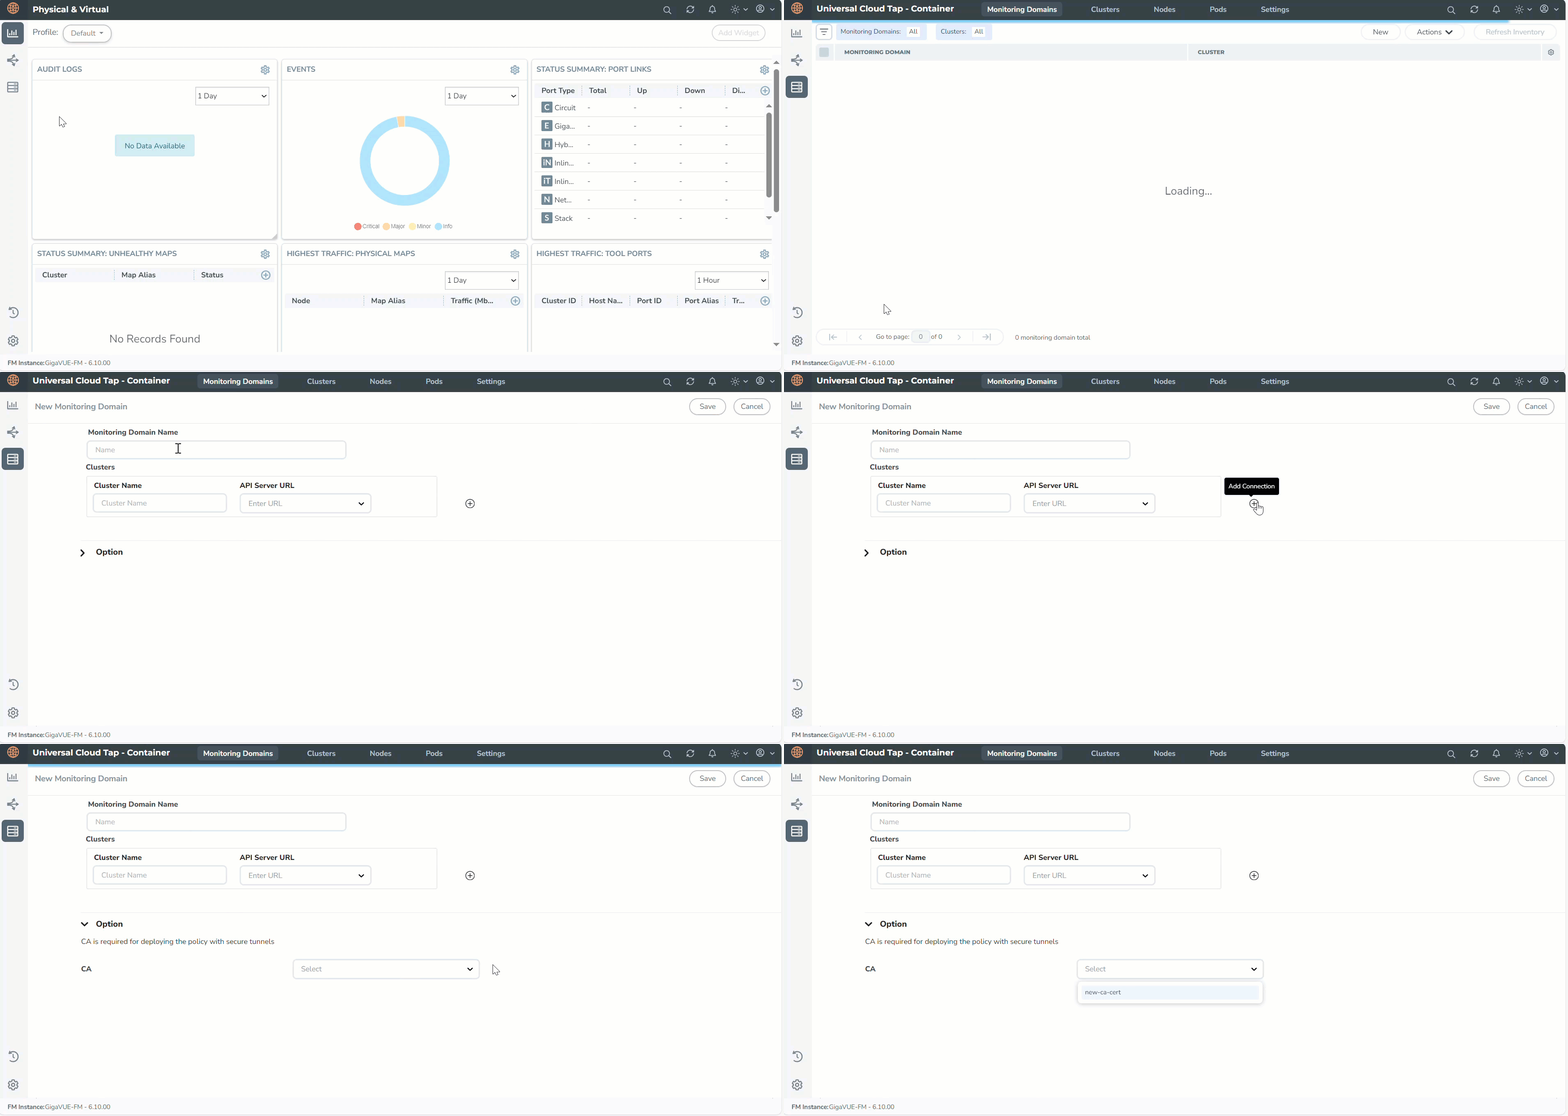
| 3. | Enter the name of the Monitoring Domain and the Cluster Name. |
| 4. | Enter or select the URL of the API server. |
| 5. | Select the required name for CA. |
Note: CA is required to deploy the policy with Secure Tunnels.
| 6. | Select to add another cluster or select to add another cluster or select to remove an existing cluster. to remove an existing cluster. |
| 7. | Select Save. |
You can view the Monitoring Domain created in the list view. The list view shows the following information for UCT-C and controllers:
| Monitoring Domain: Shows the list of Monitoring Domains created. |
| Cluster: Displays the status of GigaVUE-FM to UCT-C Controller connectivity. You can click the number link next to  (connected) or the (connected) or the  (disconnected) icons to view the cluster details for the selected Monitoring Domain. (disconnected) icons to view the cluster details for the selected Monitoring Domain. |
Use the following buttons to manage your Monitoring Domain:
| New: Use to create a new Monitoring Domain. |
| Actions: Use to edit or delete the Monitoring Domain(s). |
| Refresh Inventory: Triggers Inventory Refresh on all Clusters in the Monitoring Domain. |
Note: IP forwarding should be enabled on all worker nodes in the cluster.
Create Source Selectors
When setting up a traffic flow, it is important to define the selection criteria for the sources of traffic. You should configure the sources of the traffic that you want to monitor.
DefaultExclusion: It is a default source selector applied to all policies. You can modify but not delete it. After modifying the DefaultExclusion source selector, you need to redeploy policies for the changes to take effect. DefaultExclusion appears by default on the Source Selector Specifications page.
| To exclude the pods from monitoring, you can add criteria to DefaultExclusion. From the drop-down list, select any of the following Object Property to exclude them from the monitoring, and provide the value for the property selected in the value field: |
| • | servicename |
| • | serviceip |
| • | podname |
| • | podip |
| • | podlabels |
| • | nodename |
| • | namespace |
| • | nodepodcidr |
By default, pods in kube-system namespace, and metallb-system namespace are excluded from monitoring.
| You can add criteria to DefaultExclusion to exclude nodenames where UCT-C TAP is not launched. If Master node(s) does not have UCT-C TAP, add master node names to DefaultExclusion. |
| During the upgrade from version less than 6.10, GigaVUE‑FM automatically removes the Host Network criteria from the DefaultExclusion Source Selector and adds the Host Network Enabled Exclusion Criteria by default to all the existing policies. |
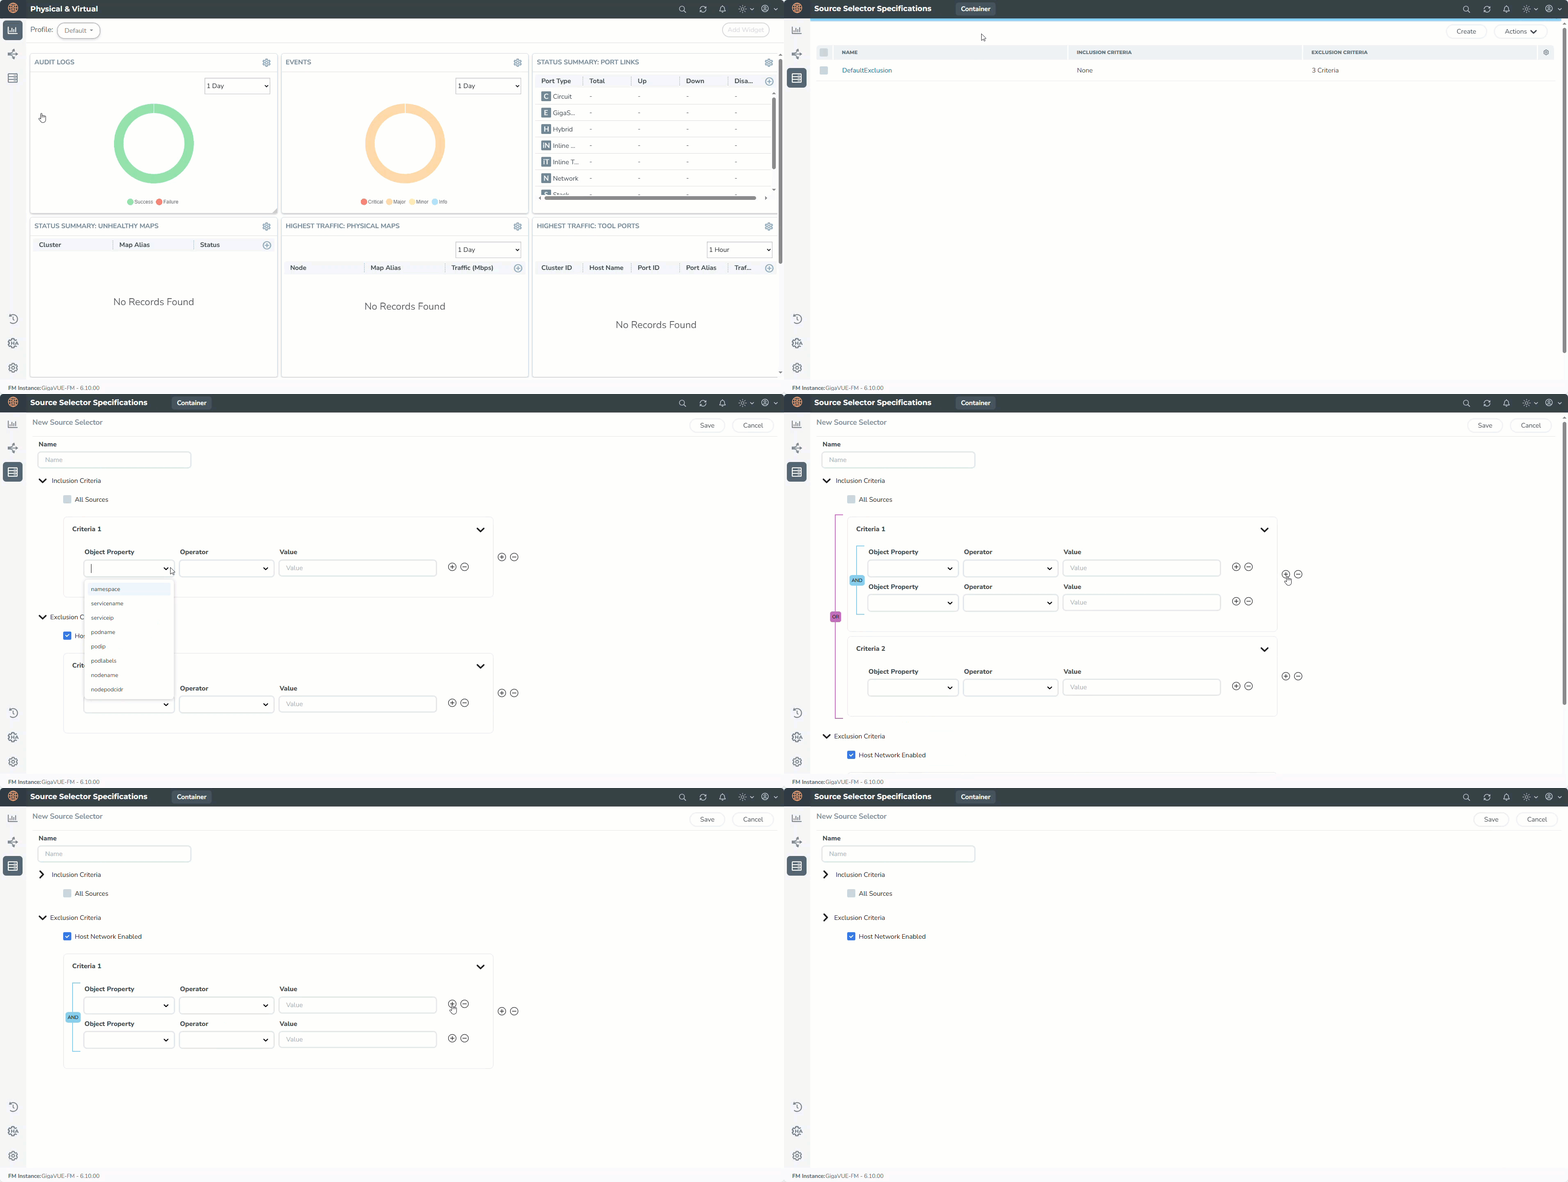
To configure the Source Selectors,
| 1. | Go to Inventory > Resources> Source Selectors> Container. |
| 2. | On the Source Selector Specifications page, navigate to the Container tab. |
| 3. | On the Source Selector Specifications page for Containers, select Create. The New Source Selector wizard appears. |
| 4. | Enter the name of the source. |
| 5. | In the Inclusion Criteria, select from the following options: |
| a. | All Sources: Select this option to acquire traffic from all namespaces and pods within the selected cluster(s). The traffic volume may be large, depending on the cluster(s) size. |
| b. | Criteria1: Enter the following options: |
Select an object property to filter the traffic source.
Select the operator and enter the values for the filter (values are case-sensitive).
On the Criteria, select
to add another Object and select
to remove an existing Object.
| 6. | In the Exclusion Criteria, select or enter the following options: |
| a. | Select an object property to filter the traffic source. |
| b. | Select the operator and enter the values for the filter (values are case-sensitive). |
| c. | Select the Host Network Enabled to view the configuration in your policies. The UCT Container TAP introduces support for tapping Host Network Enabled pods. For details, refer to the Exclusion Criteria. |
| 7. | On the Inclusion or Exclusion Criteria sections, select  to add another Criteria and select to add another Criteria and select  to remove an existing Criteria. to remove an existing Criteria. |
| 8. | Select Save. |
- If you configure multiple objects in a criteria, the traffic is filtered only if all the object rules are true (AND condition).
- If you configure multiple criteria, then the traffic is filtered even if one of the criteria is true (OR condition).
Exclusion Criteria
Host Network Enabled - The UCT-C introduces support for tapping Host Network Enabled pods. By default, this check box is selected indicating that you are excluding the host network enabled pods.
When you want to monitor the pod, clear the Host Network Enabled checkbox. A warning message appears and requires your confirmation to proceed with tapping pods with Host Network Enabled.
-
Worker Node must have cgroup version 2 to support the Host Network Enabled feature.
-
If the Worker Node has cgroup version 1, the policy deployment status for pod shows an error message.
-
When tapping Host Network enabled pods, tapped traffic is sent to user space for tunneling. It uses performance buffers, requiring more memory. To accommodate this, increase the memory request/limit to at least 1GB for UCT-C taps.
Identify the cgroup Version on the Worker Node
Use one of the following options to verify which cgroup version your distribution uses:
-
Run the stat -fc %T /sys/fs/cgroup/ command on the worker node:
-
For cgroup v2, the output iscgroup2fs.
-
For cgroup v1, the output is tmpfs.
-
-
Check if /sys/fs/cgroup/cgroup.controllers is present, then it is cgroup v2.
Identify the cgroup Version for Worker Pod
To check which cgroup version your worker pod uses:
| 1. | Log in to the worker pod. |
| 2. | Select the file /proc/$$/cgroup. The file with net_cls represent cgroup v1. The file without net_cls represent cgroup v2. |
Create Tunnel Specifications
You can use one of the following tunnel types:
-
L2GRE
-
VXLAN
-
TLS-PCAPNG.
The tunnel is an egress tunnel. For more information on creating a tunnel of type TLS-PCAPNG, refer to Secure Tunnels.
Note: The L2GRE tunnel is not supported on the Azure platform.
To configure the tunnels:
| 1. | Go to Inventory > Resources > Tunnel Specifications. |
| 2. | On the Tunnel Specifications page, navigate to the Container tab and select Create. The Create Tunnel Specification wizard appears. |
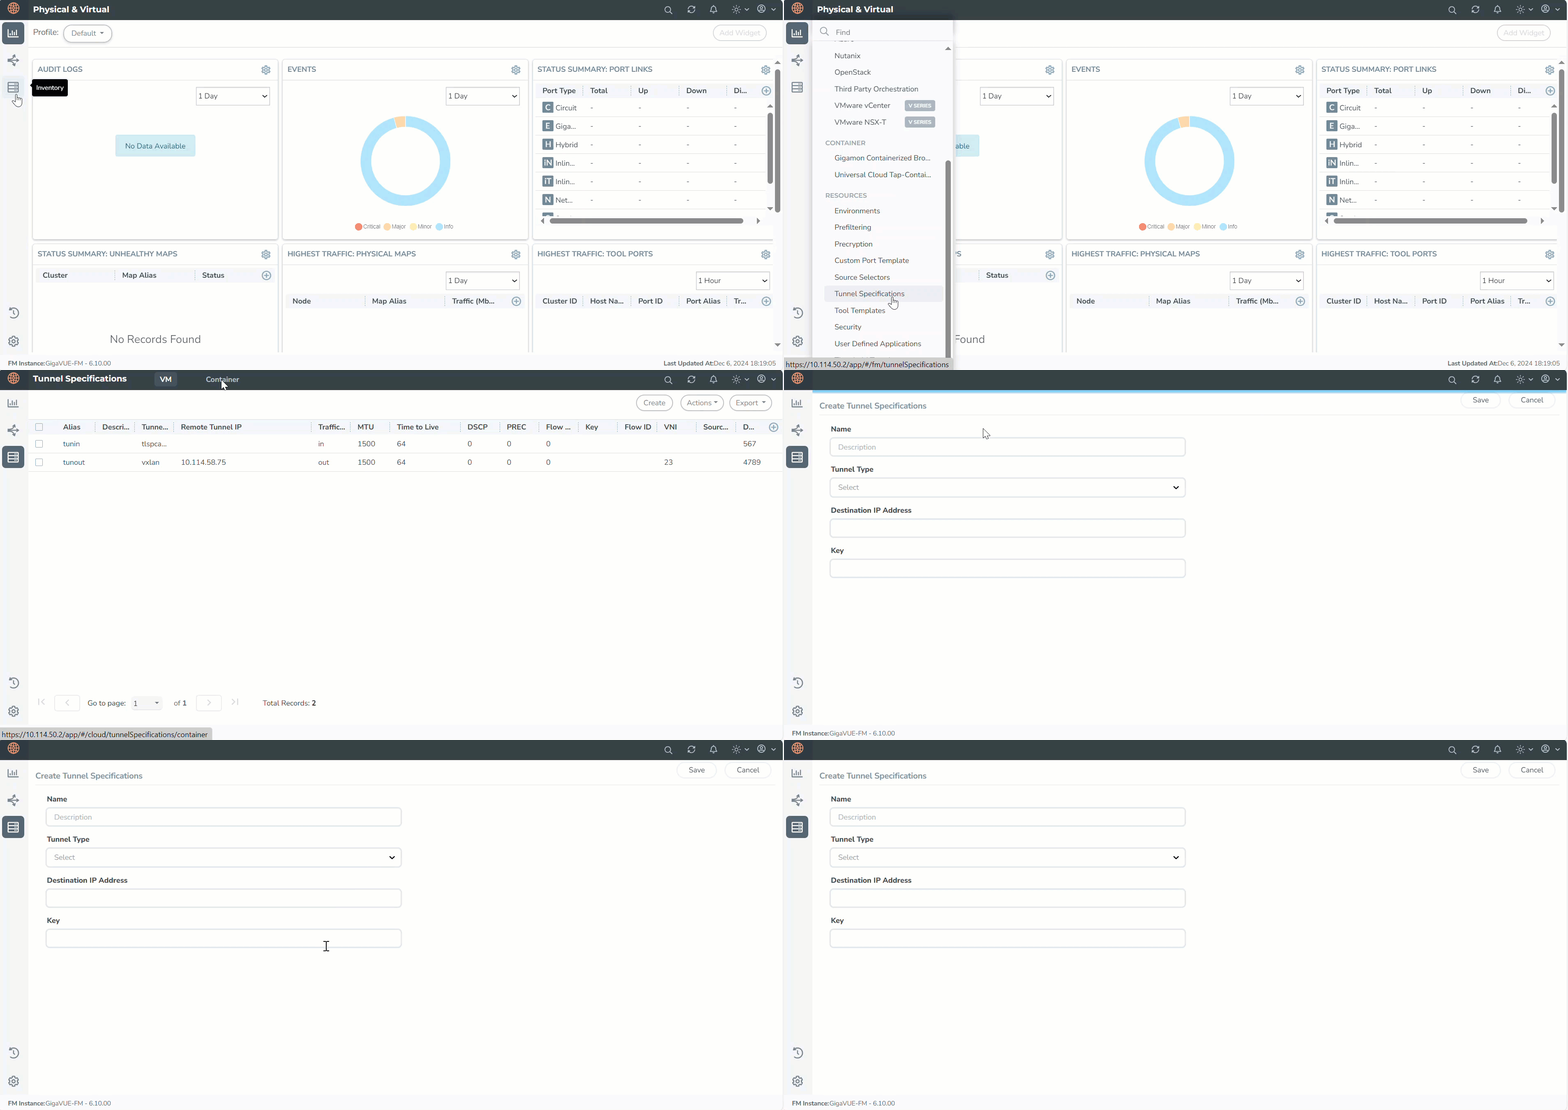
| 3. | Enter the name of the tunnel endpoint. |
Note: Do not enter spaces in the alias name.
| 4. | Select L2GRE, VXLAN, or TLS-PCAPNG tunnel type to create a tunnel. |
| 5. | Enter the IP address of the destination endpoint. |
| 6. | Enter a value for the tunnel key (applicable when the selected tunnel type is L2GRE). |
| 7. | Enter the identifier key for the VXLAN network (applicable when the selected tunnel type is VXLAN). |
| 8. | Specify the destination port value. |
| 9. | Enter a value between 1 and 65535 (applicable when the selected tunnel type is VXLAN or TLS-PCAPNG). |
| 10. | Select Save. |
Configure Traffic Policy
The traffic from the workload pods is processed based on the Traffic Policy configuration. The UCT-C TAP routes the traffic to the tunnel destination IP addresses specified in the Traffic Policy rules.
You can refer to the GigaVUE API Reference for detailed information on the REST APIs of UCT-C.
To create UCT-C Traffic Policy in GigaVUE-FM, follow these steps:
| 1. | Go to Traffic > CONTAINER > Universal Cloud Tap - Container. The Policies page appears. |
| 2. | In the Policies page, select New. The Create Policy wizard appears. |
Note: You can deploy a maximum of eight policies per Monitoring Domain.
| 3. | In the General tab, enter a unique name for the Traffic Policy. |
| 4. | Select an existing Monitoring Domain. To create a new monitoring domain, refer to Create Monitoring Domain. |
| 5. | Select the required cluster from the drop-down menu. |
| 6. | Select the radio button Yes, to enable the Precryption rules for the policy. You can select No to enable the Mirroring. For details, refer to Configure Precryption in UCT-C. |
Notes:
Once the policy is deployed, you cannot change the Precryption Policy setting.
You can deploy only one Precryption policy per Monitoring Domain.
| 7. | Select Next to switch to the Source Selectors tab. |
| 8. | Select an existing source selector and select Add > Create New. To create a new source selector, refer to Create Source Selectors. You can configure a maximum of eight source selectors per policy. |
| 9. | In the Source Selectors page, select  to expand the Default Exclusion section. to expand the Default Exclusion section.DefaultExclusion Source Selector is applied automatically for all policies. |
Note: You can edit the values across the Monitoring Domain in Inventory > Resources > Source Selectors section. On the Source Selectors Specifications page, navigate to Container > Default Exclusion. In the Edit Source Selector wizard, you can edit the values in the Exclusion Criteria section.
| 10. | Select Next to switch to the Rules tab. You must select CA in the Monitoring Domain page to use secure tunnels in rules. |
| 11. | Enter or select the required information for the Ingress Rules and the Egress Rules as described in the following steps: |
| a. | Select an existing tunnel or select Create New. For details, refer to Create Tunnel Specifications. For Precryption, only one Tunnel Specification field is displayed at the top for all the rules. For Mirroring, Tunnel Specification is configured for every individual rule. |
| b. | On the Ingress or Egress rules, select  to add another rule and select to add another rule and select to remove an existing rule. You must select CA in the Monitoring Domain page to use secure tunnels in rules. to remove an existing rule. You must select CA in the Monitoring Domain page to use secure tunnels in rules. |
| c. | Enter a unique name for the rule. |
Note: We do not recommend Rule names ending with __I, __E, __RI, __RE as the names are invalid in policy rules. Rule names such as passall, ingress-passall, and egress-passall are restricted.
| d. | Select On to enable the passall rule or select Off to disable the passall rule. For details, refer to Enable Selective Precryption to add the filters when you choose to disable the passall rule. |
| e. | Select Pass to allow the packets or select Drop to block the packets based on the filters. |
| f. | Select the direction from the following options: |
| • | Bidirectional - Taps the traffic in both directions. Each bidirectional rule adds 2 ingress rules and 2 egress rules |
Note: When you apply filters to two pods on the same worker node to capture traffic in both directions, only one copy of the packet is tunneled out for each packet traveling from one pod to the other.
| • | Ingress- Taps the ingress traffic |
| • | Egress - Taps the egress traffic |
| • | Ingress Pass All - Taps all the ingress traffic |
| • | Egress Pass All - Taps all the egress traffic |
Note: The maximum number of rules supported per direction is 32.
| g. | Enter a priority value in the range 1-256 to specify the order of rule execution on the selected Pod. Unique Priority is enforced in a policy within ingress and egress space. Bidirectional rules get expanded in ingress and egress space. Priority is not applicable for Drop Rules. Drop Rules are executed first, followed by passall rules, and then filter rules based on specified priority values. |
| 12. | Select Next to switch to the Validate tab. |
| 13. | Select Save to the policy or click Deploy. The selected traffic policy rules are deployed to the required UCT-C TAPs present on the nodes corresponding to the source pods selected for monitoring. |
Note: If policy deployment for pods fails with a Duplicate Filter Rules error, you need to decide which policy to apply to monitor the pod and remove the overlapping sources from the failed polcy.
View Policy Configurations
To view the Policy Configurations of the traffic policy configured in the GigaVUE-FM,
-
Go to Traffic > CONTAINER > Universal Cloud Tap - Container.
The Policies page appears.
-
Select the required policy name.
The configurations appear on the bottom of the Policies page. You can view the following tabs along with the policy name:
| Source Specifications |
| Mirroring Rules |
You can scroll each of the tables to view more columns. The fields and description for the tab are described in the respective topics.
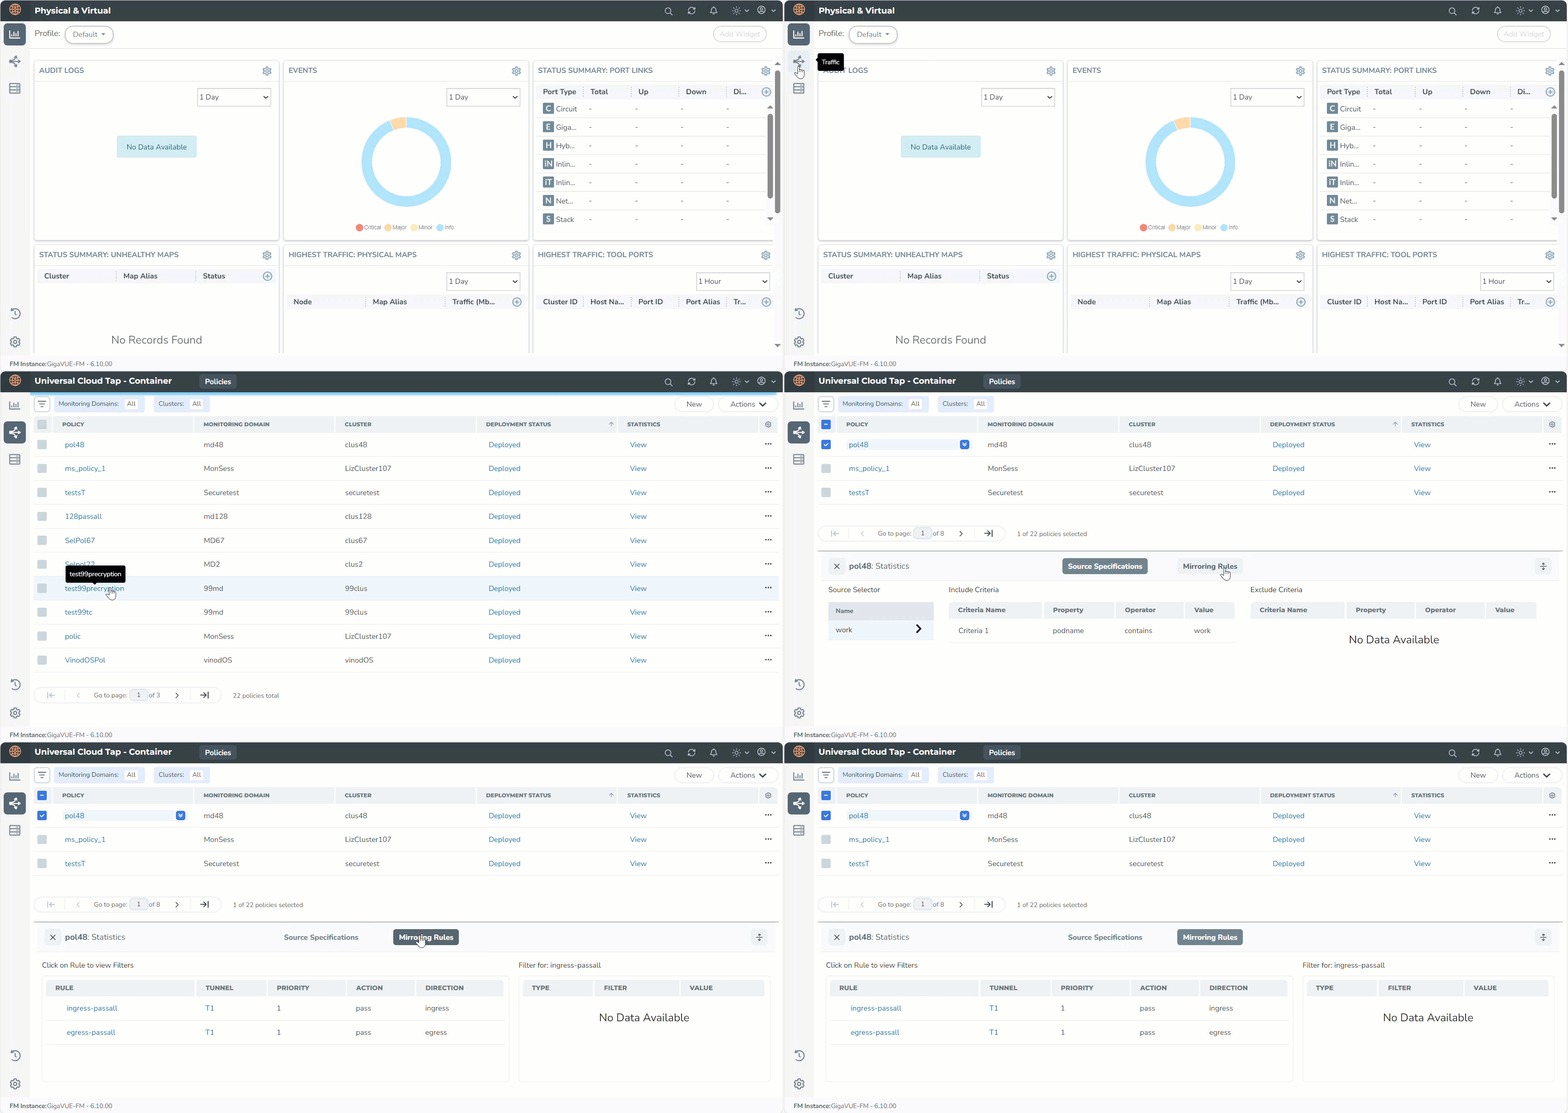
Source Specifications
You can view the criteria based on which a pod is selected for tapping.
The fields and descriptions of the source specifications tab are described in the following table:
|
Tab- Source Specifications |
Field |
Description |
||||||||||||||||||||||||
|---|---|---|---|---|---|---|---|---|---|---|---|---|---|---|---|---|---|---|---|---|---|---|---|---|---|---|
|
Source Selector |
|
|
||||||||||||||||||||||||
|
|
Name |
Specifies the name of the Source selector. |
||||||||||||||||||||||||
|
Include Criteria |
|
|
||||||||||||||||||||||||
|
|
Criteria Name |
Specifies the include criteria for the source selector. Pod that matches the include criteria is part of the source for the given traffic policy. |
||||||||||||||||||||||||
|
|
Property |
Specifies the attributes of the pod. The available attributes are:
|
||||||||||||||||||||||||
|
|
Operator |
Specifies the operator used in the criteria. |
||||||||||||||||||||||||
|
|
Value |
Specifies the value for the attributes in the criteria. |
||||||||||||||||||||||||
|
Exclude Criteria |
|
|
||||||||||||||||||||||||
|
|
Criteria Name |
Specifies the exclude criteria for the source selector. Pod that matches the exclude criteria will be excluded from the source for the given traffic policy. |
||||||||||||||||||||||||
|
|
Property |
Specifies the property in the exclude criteria based on which the pod associated with the source is excluded. |
||||||||||||||||||||||||
|
|
Operator |
Specifies the operator involved in the exclude criteria in tapping the traffic in the pod. |
||||||||||||||||||||||||
|
|
Value |
Specifies the value in the criteria based on which traffic in the pod is excluded. |
Mirroring Rules
You can view the aggregate value of all the rules configured for the policy on the node in the UCT-C TAP present in a cluster. The fields and their descriptions in the Mirroring Rules tab are detailed in the following table:
|
Tab-Rules Rules |
Field |
Description |
|---|---|---|
|
Mirroring Rules |
|
|
|
|
Rule |
Specifies the name of the rules in which the traffic is filtered in the pod. Click on the Rule name to view the filters. |
|
|
Tunnel |
Specifies the tunnel details which is associated with the rules to send the traffic out. When you hover over the tunnel specification value, you can view the details of the tunnel in a message box. |
|
|
Priority |
Specifies the priority assigned for the rule. |
|
|
Action |
Specifies whether to pass or drop the rule. |
|
|
Direction |
Specifies whether the traffic flow direction is ingress, egress, or bidirectional (both directions). |
|
Filter |
|
|
|
|
Type |
Specifies the filter type. |
|
|
Filter |
Specifies the name for the filter. |
|
|
Value |
Specifies the value of the filter. |
View Traffic Policy Statistics
Traffic Policy Statistics in the GigaVUE-FM provide visibility of the policies within a Monitoring Domain.
-
When you deploy a policy on a worker Node, UCT-C TAP pods report policy statistics to GigaVUE‑FM.
-
These reports are generated at the pod level and include counter data for each policy.
-
Policy statistics are sent to GigaVUE-FM every 5 minutes.
-
GigaVUE-FM displays the statistics from the latest cycle received.
Note: Ensure that your UCT-C and GigaVUE-FM are time synchronized or configure NTP time synchronization.
The statistics counters reflect the activities of the deployed policies. They show how the policy statistics are directly related to the policy configured through GigaVUE-FM. For information regarding dashboard visualizations for Policy statistics, refer to Analytics Dashboard for UCT-C.
To view the policy configurations of the traffic policy configured in the GigaVUE-FM,
| 1. | Go to Traffic > CONTAINER > Universal Cloud Tap - Container. The Policies page appears. |
| 2. | Select View status link in the Statistics column of a selected policy. The Policy Statistics appear at the bottom of the Policies page. |
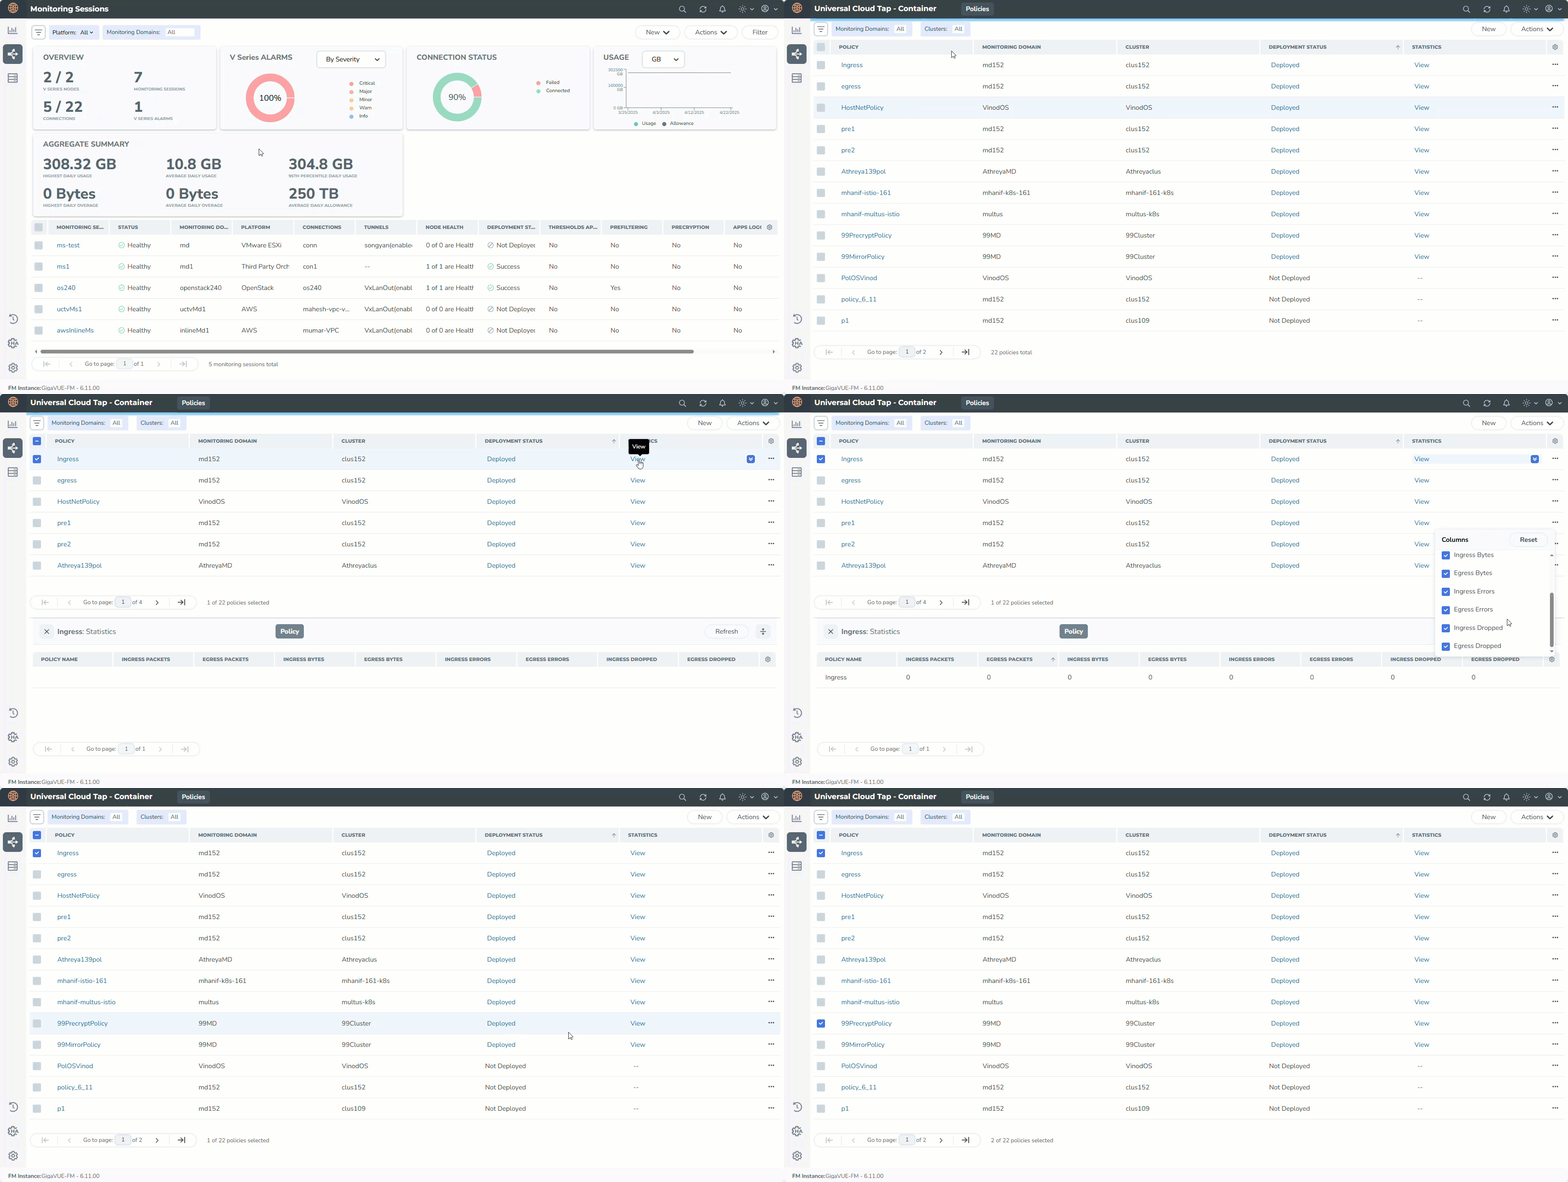
|
Fields |
Description |
|---|---|
|
Policy Name |
Name of the policy. |
|
Ingress Packets |
Total aggregate value of the ingress packets associated with the policy. |
|
Egress Packets |
Total aggregate value of the egress packets associated with the policy. |
|
Ingress Bytes |
Total aggregate value of the ingress bytes associated with the policy. |
|
Egress Bytes |
Total aggregate value of the egress bytes associated with the policy. |
|
Ingress Errors |
Total aggregate value of the ingress errors associated with the policy. |
|
Egress Errors |
Total aggregate value of the egress errors associated with the policy. |
|
Ingress Dropped |
Total aggregate value of the ingress packets dropped associated with the policy. |
|
Egress Dropped |
Total aggregate value of the egress packets dropped associated with the policy. |


